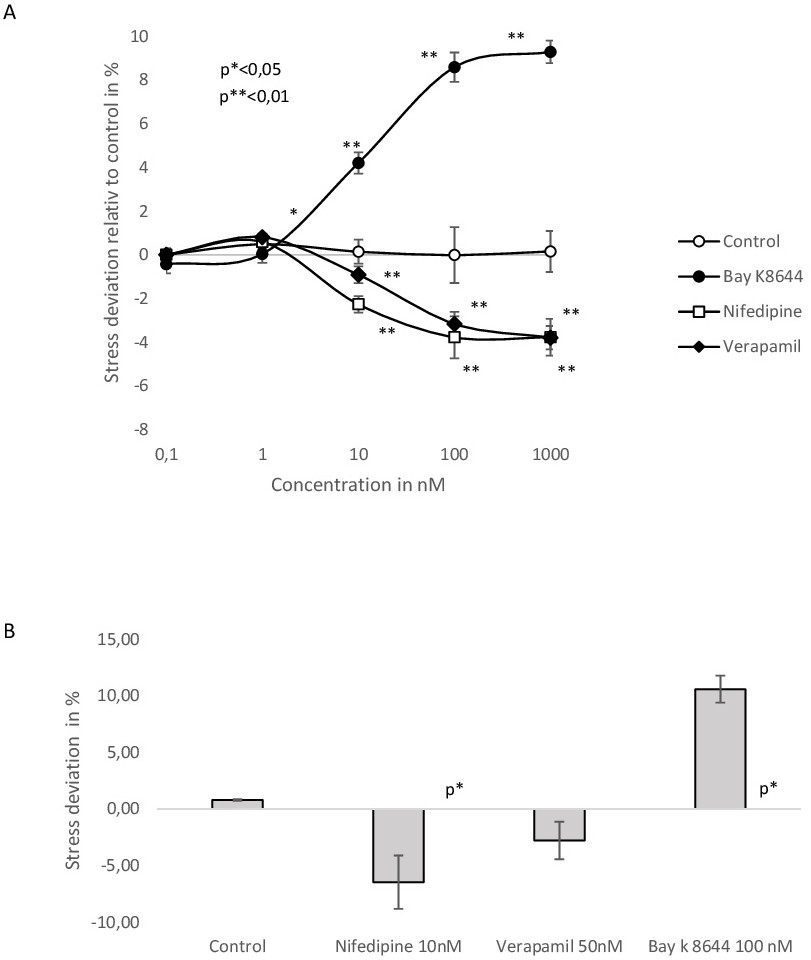
Fig. 4. Data measured by the PTM. A) Dose-response model of all tested agents in the concentrations of 0.1nM, 1nM, 10nM, 100nM and 1µM. Y-Axis indicates the deviation in mechanical stress relative to control in % to the initial stress. The X-Axis represents the substance concentration on a log scale. Every data point represents five (n=5) measurements taken from six individual samples(N=6). The error bars indicate the SEM. The statistical evaluation was carried out using the T-test for dependent samples. The control shows no significant change(p>0,05), but all test substances after the addition of 10nM result in a highly significant effect (p**<0.01).B) Relaxation or contraction after five minutes compared to the initial stress. Each bar represents five (n=5) measurements taken from six individual samples(N=6). The error bars indicate the SEM. The data were statistically evaluated using the paired T-test to prove significant mechanical changes from the initial specimen-tension. In relation to the initial measurement, Control (p=0.775) and treatment with verapamil did not produce any significant effect (p=0.229). In contrast, the effect of nifedipine (p*=0.047) and Bay k 8644 (p*=0.036) leads to a significant change in cellular tone.